Uplift and SPRINT
library(uplift)
x <- read.csv("sprint baseline and outcomes corrected.csv", as.is=TRUE)

x$alive <- 1 - x$event_mi

col2fac <- c("smoke_3cat", "aspirin", "female", "race4", "statin")
x[col2fac] <- lapply(x[col2fac], factor)

cols <- c("alive", "intensive",
  "risk10yrs", "sbp", "dbp", "n_agents",
  "egfr", "screat", "age", "chr", "glur",
  "hdl", "trr", "umalcr", "bmi",
  "smoke_3cat", "aspirin", "female", "race4", "statin")
x <- x[,cols]
x <- x[complete.cases(x),]set.seed(1)
samp <- sample.int(nrow(x))
train <- samp[1:7000]
fit1 <- upliftRF(alive ~
risk10yrs +
sbp + dbp + n_agents + smoke_3cat +
aspirin + egfr + screat +
age + female + race4 +
chr + glur + hdl + trr + umalcr +
bmi + statin
+ trt(intensive),
data = x[train,],
mtry = 7,
ntree = 60,
split_method = "KL",
minsplit = 20,
verbose = FALSE)
vals <- predict(fit1, x[train,])
upliftscores <- vals[,1] - vals[,2]
hist(upliftscores, breaks=20)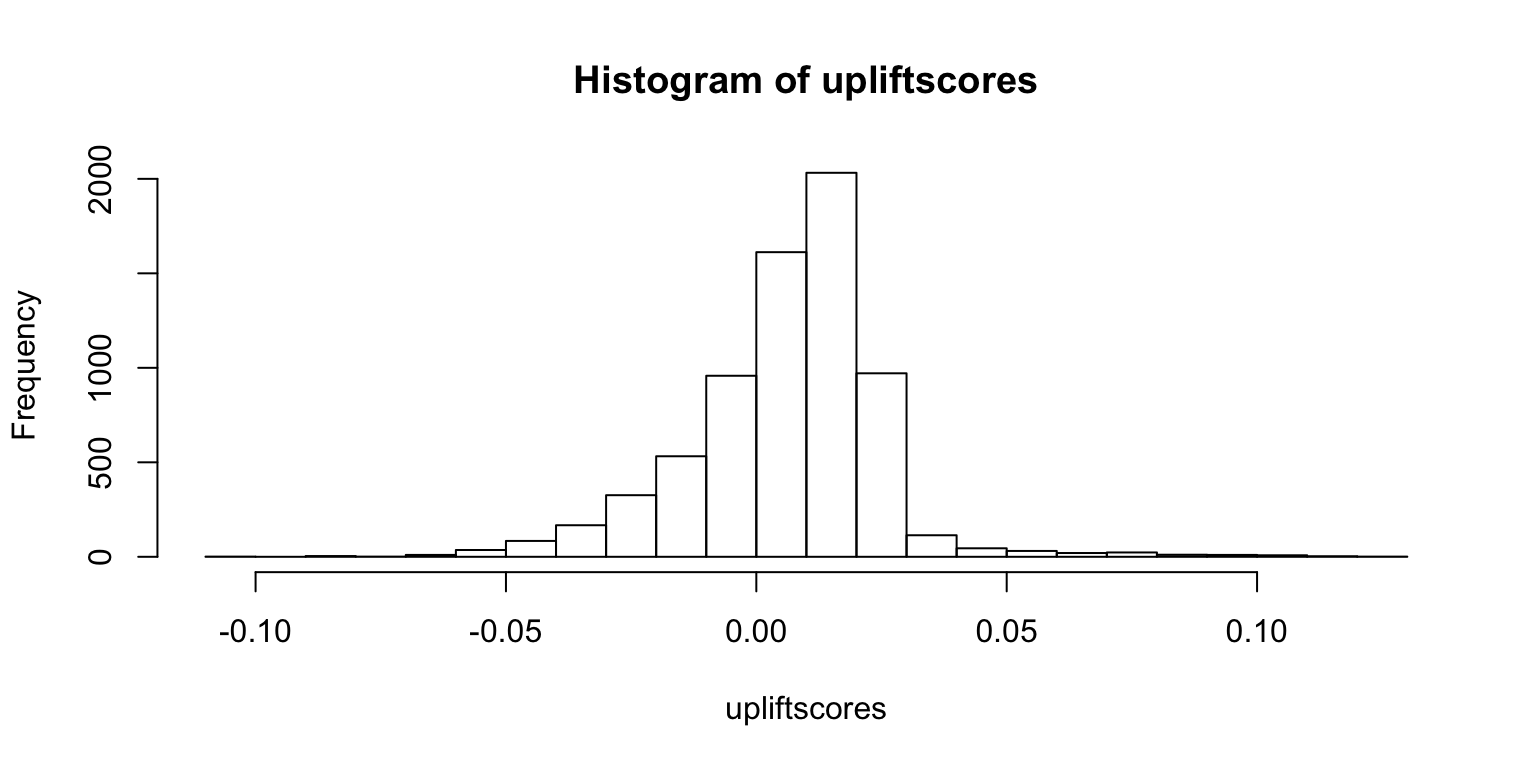
Permutation Test:
x$alive.random <- sample(x$alive)
fit2 <- upliftRF(alive.random ~
                   risk10yrs +
                   sbp + dbp + n_agents + smoke_3cat +
                   aspirin + egfr + screat +
                   age + female + race4 +
                   chr + glur + hdl + trr + umalcr +
                   bmi + statin
                 + trt(intensive),
                 data = x[train,],
                 mtry = 7,
                 ntree = 60,
                 split_method = "KL",
                 minsplit = 20,
                 verbose = FALSE)

vals.random <- predict(fit2, x[train,])
upliftscores.random <- vals.random[,1] - vals.random[,2]
hist(upliftscores.random, breaks=20)
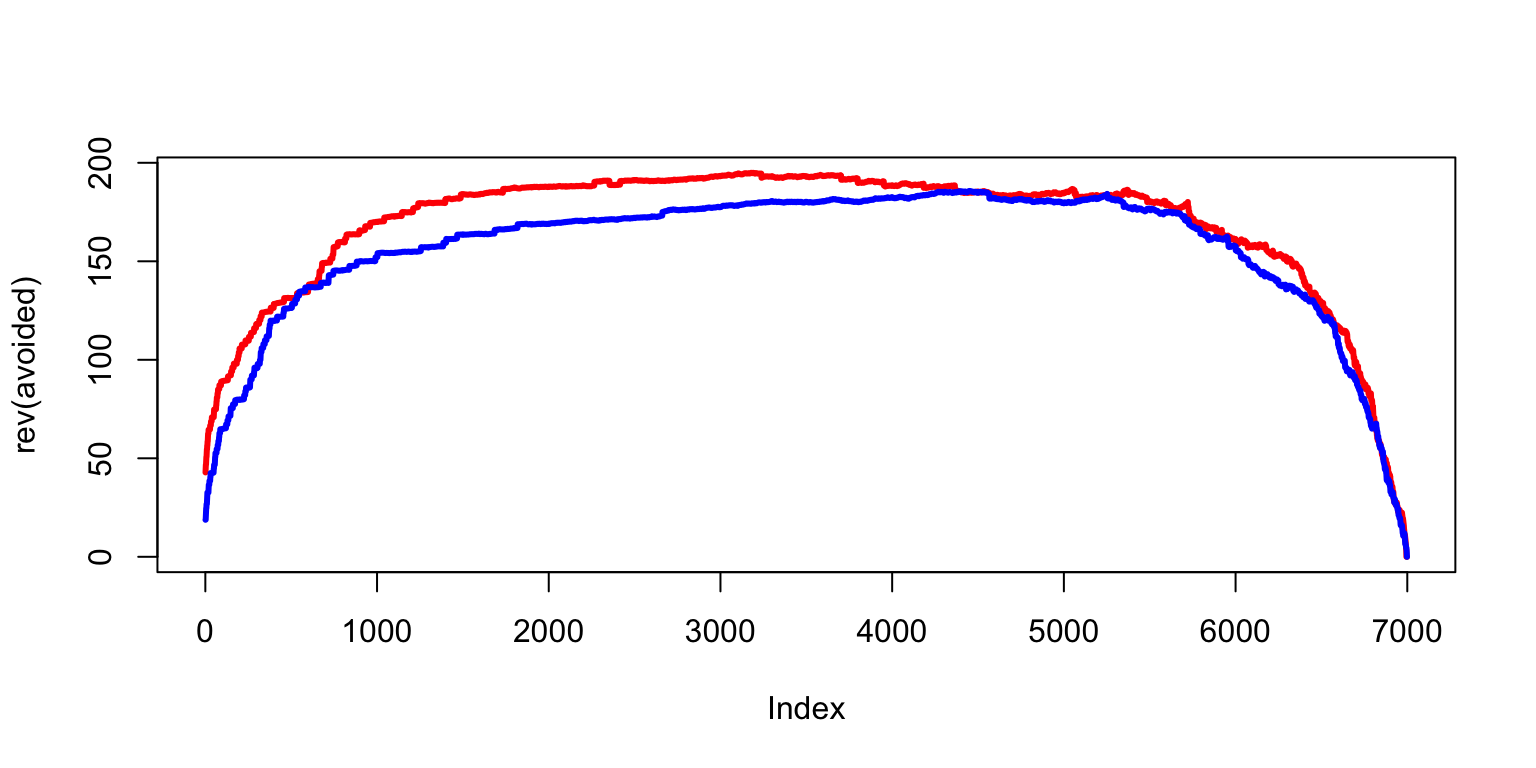
Uplift Graph
o <- order(upliftscores, decreasing=TRUE)
avoided <- rep(NA, nrow(vals))
counts <- rep(0, 2) # num alive in ctrl, num alive in trt
denom <- rep(0, 2) # total in ctrl, num total in trt
for (target in 1:nrow(vals)) {
  if (x$intensive[train[o[target]]] == 1) {
    counts[2] <- counts[2] + x$alive[train[o[target]]]
    denom[2] <- denom[2]+1
  } else {
    counts[1] <- counts[1] + x$alive[train[o[target]]]
    denom[1] <- denom[1]+1
  }
  fracs <- counts/denom
  avoided[target] <- (fracs[2]-fracs[1])*target
}

o <- order(upliftscores.random, decreasing=TRUE)
avoided.random <- rep(NA, nrow(vals.random))
counts <- rep(0, 2) # num alive in ctrl, num alive in trt
denom <- rep(0, 2) # total in ctrl, num total in trt
for (target in 1:nrow(vals.random)) {
  if (x$intensive[train[o[target]]] == 1) {
    counts[2] <- counts[2] + x$alive.random[train[o[target]]]
    denom[2] <- denom[2]+1
  } else {
    counts[1] <- counts[1] + x$alive.random[train[o[target]]]
    denom[1] <- denom[1]+1
  }
  fracs <- counts/denom
  avoided.random[target] <- (fracs[2]-fracs[1])*target
}plot(rev(avoided), type="l", lwd=3, col="red")
points(rev(avoided.random), type="l", lwd=3, col="blue")